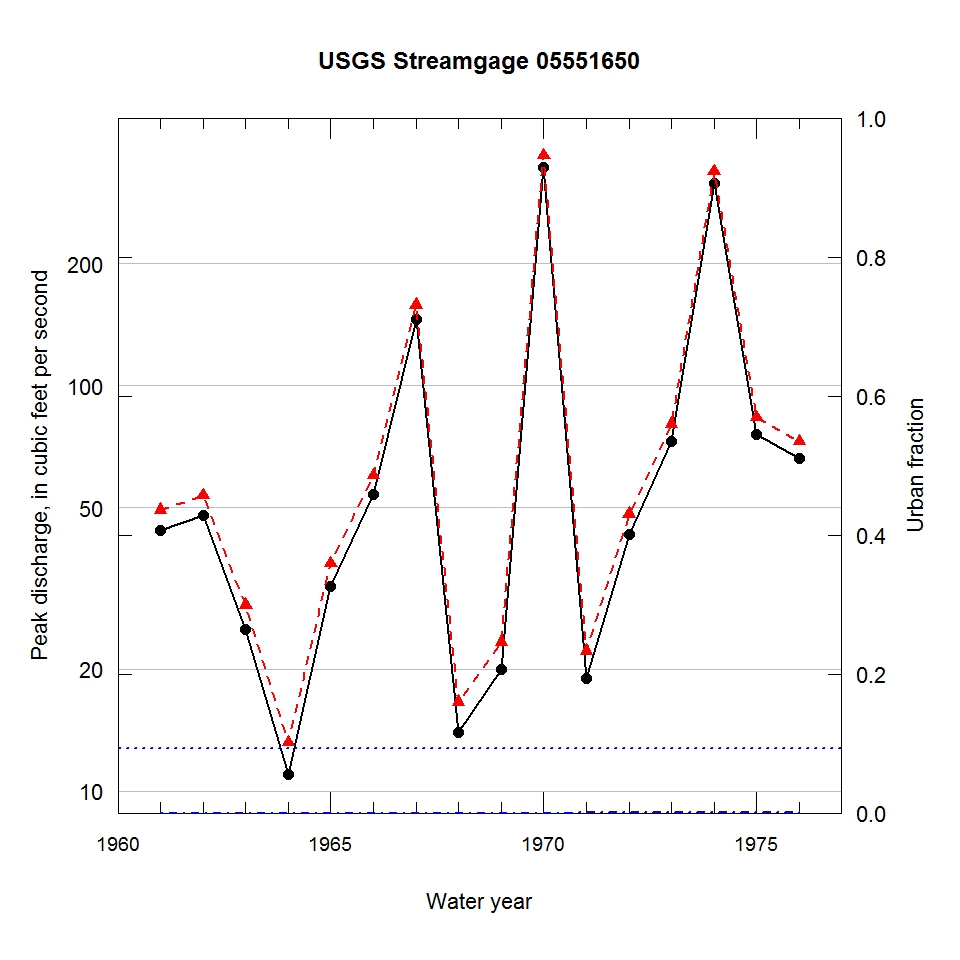
Observed and urbanization-adjusted annual maximum peak discharge and associated urban fraction and precipitation values at USGS streamgage:
05551650 LAKE RUN AT BALD MOUND, IL


| Water year | Segment | Discharge code | Cumulative reservoir storage (acre-feet) | Urban fraction | Precipitation (inches) | Observed peak discharge (ft3/s) | Adjusted peak discharge (ft3/s) | Exceedance probability |
| 1961 | 1 | -- | 0 | 0.000 | 1.218 | 44 | 49 | 0.691 |
| 1962 | 1 | -- | 0 | 0.000 | 0.299 | 48 | 54 | 0.643 |
| 1963 | 1 | -- | 0 | 0.000 | 0.404 | 25 | 29 | 0.890 |
| 1964 | 1 | 4B | 0 | 0.000 | 0.109 | 11 | 13 | 0.976 |
| 1965 | 1 | -- | 0 | 0.000 | 0.133 | 32 | 36 | 0.825 |
| 1966 | 1 | -- | 0 | 0.000 | 1.375 | 54 | 60 | 0.571 |
| 1967 | 1 | -- | 0 | 0.000 | 1.075 | 146 | 158 | 0.061 |
| 1968 | 1 | -- | 0 | 0.000 | 1.358 | 14 | 17 | 0.960 |
| 1969 | 1 | -- | 0 | 0.000 | 0.109 | 20 | 23 | 0.928 |
| 1970 | 1 | -- | 0 | 0.000 | 1.461 | 346 | 369 | 0.005 |
| 1971 | 1 | -- | 0 | 0.000 | 0.377 | 19 | 22 | 0.933 |
| 1972 | 1 | -- | 0 | 0.000 | 0.931 | 43 | 48 | 0.703 |
| 1973 | 1 | -- | 0 | 0.001 | 1.469 | 73 | 80 | 0.360 |
| 1974 | 1 | -- | 0 | 0.001 | 1.298 | 316 | 337 | 0.007 |
| 1975 | 1 | -- | 0 | 0.001 | 0.835 | 76 | 84 | 0.336 |
| 1976 | 1 | -- | 0 | 0.001 | 1.106 | 66 | 73 | 0.426 |

